
north puller
Member
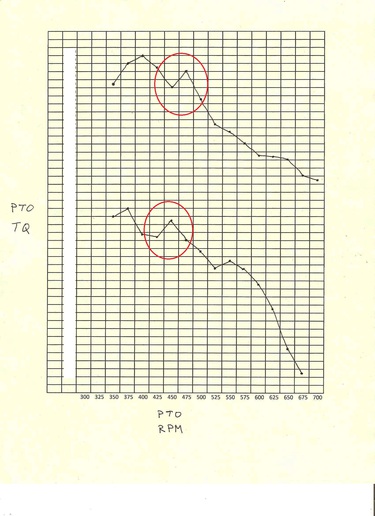
atached is a graph showing the pto torque curve of 2 farmall super m motors. The bottom is a pure stock, somewhat worn out 264 inch super m. The top is a somewhat built up 281 inch motor with higher compression and a cam.
Can anyone tell me why the torque takes a dive the way it does in the circled area? What might be going on here?
The tractors were dynoed on the same dyno, the same day. A M&W slide chart was used to calculate HP, then the HP and PTO speed were used to calculate torque.
I dynoed 3 other tractors that day, (not farmalls)and no other tractor experienced this dive in torque at 400-450 pto rpm which makes me think that it is nothing to do with the dyno.
Any idea what might be going on with these super m motors?